Portfolio

Apocollect / Elisana One
Productivity app for pharmacies but also other industries where users log into their accounts. The app uses React Native and some key features are: notifications, chat, tasks and a wiki for documentation. Product Homepage

Knaufinfothek
App for technical documentations and products by Knauf.
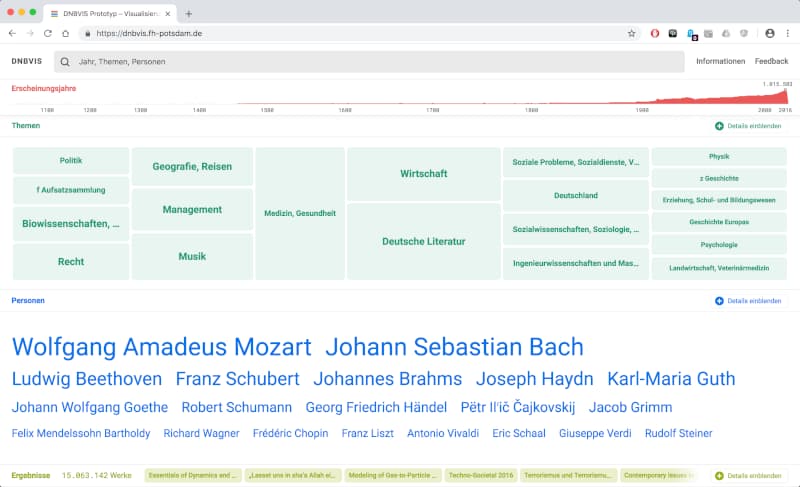
DNB VIS
Study about interactive visualizations of a comprehensive bibliograhic collection. This was a research cooperation between German National Library and University of Applied Sciences Potsdam. The project examines graphical user interfaces to large bibliographic collections in order to support exploratory information access.
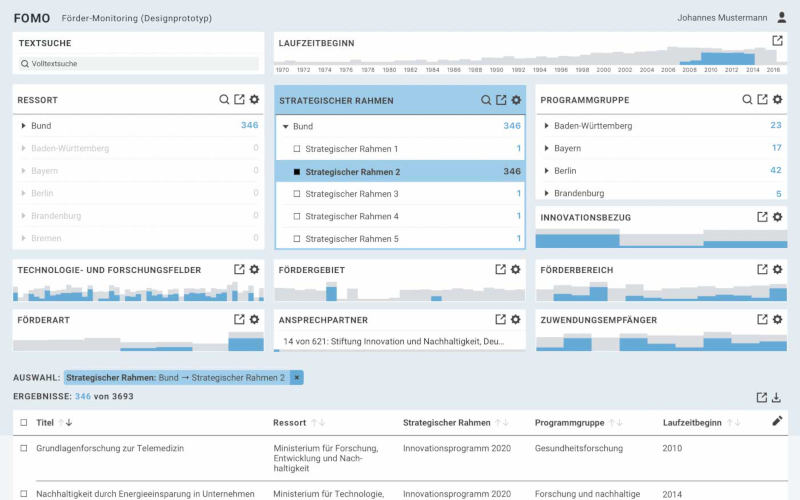
Vind
This project focused on a visual and user-centered interfaces for complex database systems. With many co-creation iterations, the team was to develop ideas for visualization components that both meet the needs of the user and that convey the inherent complexities and relationships of the data in a flexible, innovative and understandable way.

Moonwalk
Visual analysis tool for medical data. The tool is used as a visual preprocessing step before analysing gait specific patient data in algorithms.
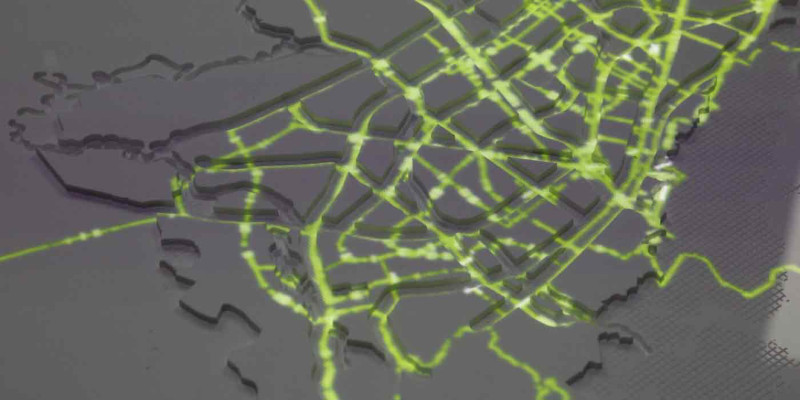
Habitat Vistent
Visualizing urban data using projection on a physical city model. This prototype was a discussion starter about the use of visualization in urban planing. The project was exhibited in Quito, Eccuador for UN Habitat III conference.

Lobbyradar
Network visualization (or actually a map) of politicians, parties and organizations in the german parliament. How they are linked due to money flow, highly paid talks in companies or even activities in supervisory boards.
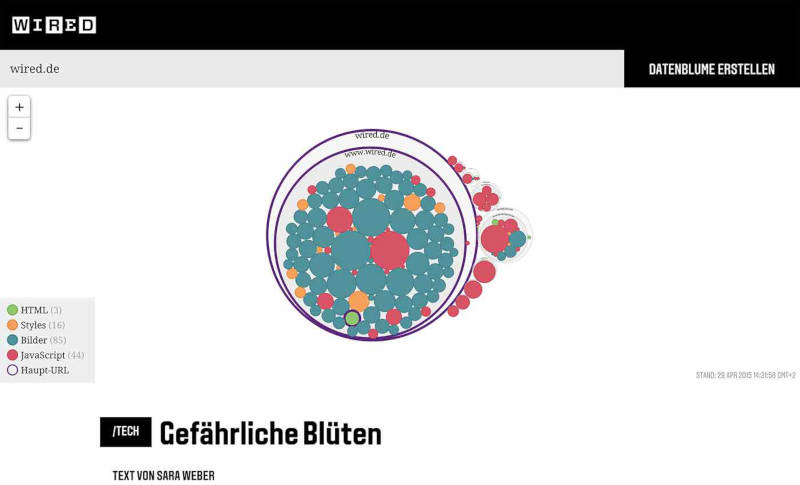
Datenblumen
Analyse content and location of content from any homepage. The stacked bubble chart shows the user where the content comes from. From main url or thirdparty server.